

Today, we look at the ETH.D daily chart, more specifically at the Relative Strength Index (RSI) indicator, and secondly, why the breakout to the upside on the ETH.D gives a very important clue as to what is to come.

Following on from yesterday’s Chart of the Day, and why the Relative Strength Index (RSI) is such an important leading indicator when it comes to charting, this time we’re going to go over the current ETH.D daily chart. What can be noticed is that the RSI already broke through the resistance trend line on January 27th 2021, but the Percentage Candle only broke through on February 1st, 2021. As of today, the percentage candle is retracing to the previous resistance trendline to test the breakout.
Why is the Ethereum Dominance Chart so important?
First, let’s take into consideration the Money Flow in Crypto.
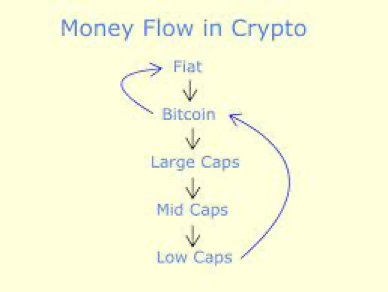
What we find is that the Crypto Market follows repeated cycles throughout the year, normally lasting 3-4 months. The “Bull Cycle” begins when the flow of fiat currency, and also stablecoins, start buying up Bitcoin. As more and more Bitcoin is bought up, the price obviously increases (the theory of offer and demand, remember?). Bitcoin is the King of Crypto, or the leading coin, so, when the price increases, this results in the rest of the market generally following suit.
Along with this Bitcoin price increase, and being the first to set the trend, there may be opportunities in other coins that have not moved yet. The money flow tends to then move into the major altcoins, like ETH, SOL, LTC and XRP. From there, the dollars start trickling down into the mid-caps, and then into the micro-caps, resulting in a full-blown “Altcoin Season”. Then comes that dreaded but essential correction, or a retrace in price, which brings us back to the beginning of the cycle as investors buy the dip.
What is interesting to point out at the moment is that we have seen a breakout of the ETH Dominance Chart, and together with the break to the downside of the Bitcoin Dominance Chart, it looks like this could spell the start of an “Altcoin Season”. And we all know how that can go! History has shown that there are potentially massive gains to be had in some of the altcoins over this bullish period.


