
Using CoinPanel is the same as having Sheldon the Sniper in your back pocket, all day, every day. Learn how to use these tools in an easy way, or even just copy and paste Sheldon’s techniques with a few clicks of a button!
Use the link below to sign up today and stand a chance to win in our giveaways!
LINK HERE
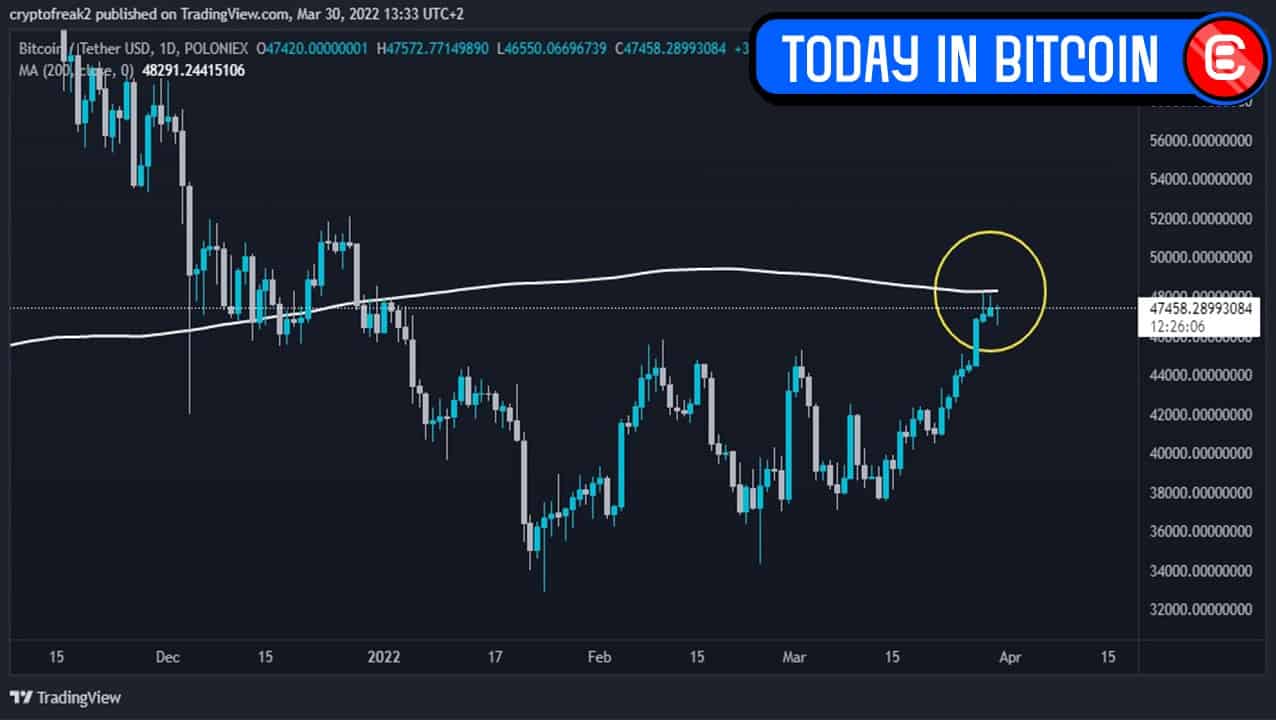
The daily 200 Moving Average (MA) indicator has been acting as major resistance for the BTC, Total Market Cap, Total 2 Market Cap and Total 3 Market Cap charts for the past few days.
The 200 Moving Average on the daily chart is the average price at which bitcoin has closed over the last 200 days.

If we look back over the last two years to see what price action has done following a break of the 200 MA on the daily, it shows that once this level is broken, a lot of traders start entering the market.
In April 2020, BTC broke the 200 MA at the US$8,000 level, and the price managed to stay above the 200 MA for over a year, reaching US$65,000 in April 2021. There was another case in October 2021, when price broke through at US$45,000, and went to a high of US$68,000 a month later.
Looking at the Total Market Cap, the 200 MA was broken to the upside in August last year (at US$1.6 trillion). Three months later, it went to an all-time high of US$3 trillion.

It’s vital that both BTC and the Total Market Cap break this daily 200 MA level, which has historically led to a market-wide rally.
The same goes for the Total 3 Market Cap chart, which refers to the market excluding BTC and ETH. A break of the 200 MA would likely go and trigger a rally for altcoins.

We will be looking very closely for a positive break above this level over the next couple of days across all three charts.
You can find all of Sheldon’s entries, take-profit zones, key support, and resistance areas by signing up to CoinPanel, where over 30 unique charts are regularly updated with all the key levels to watch out for.


